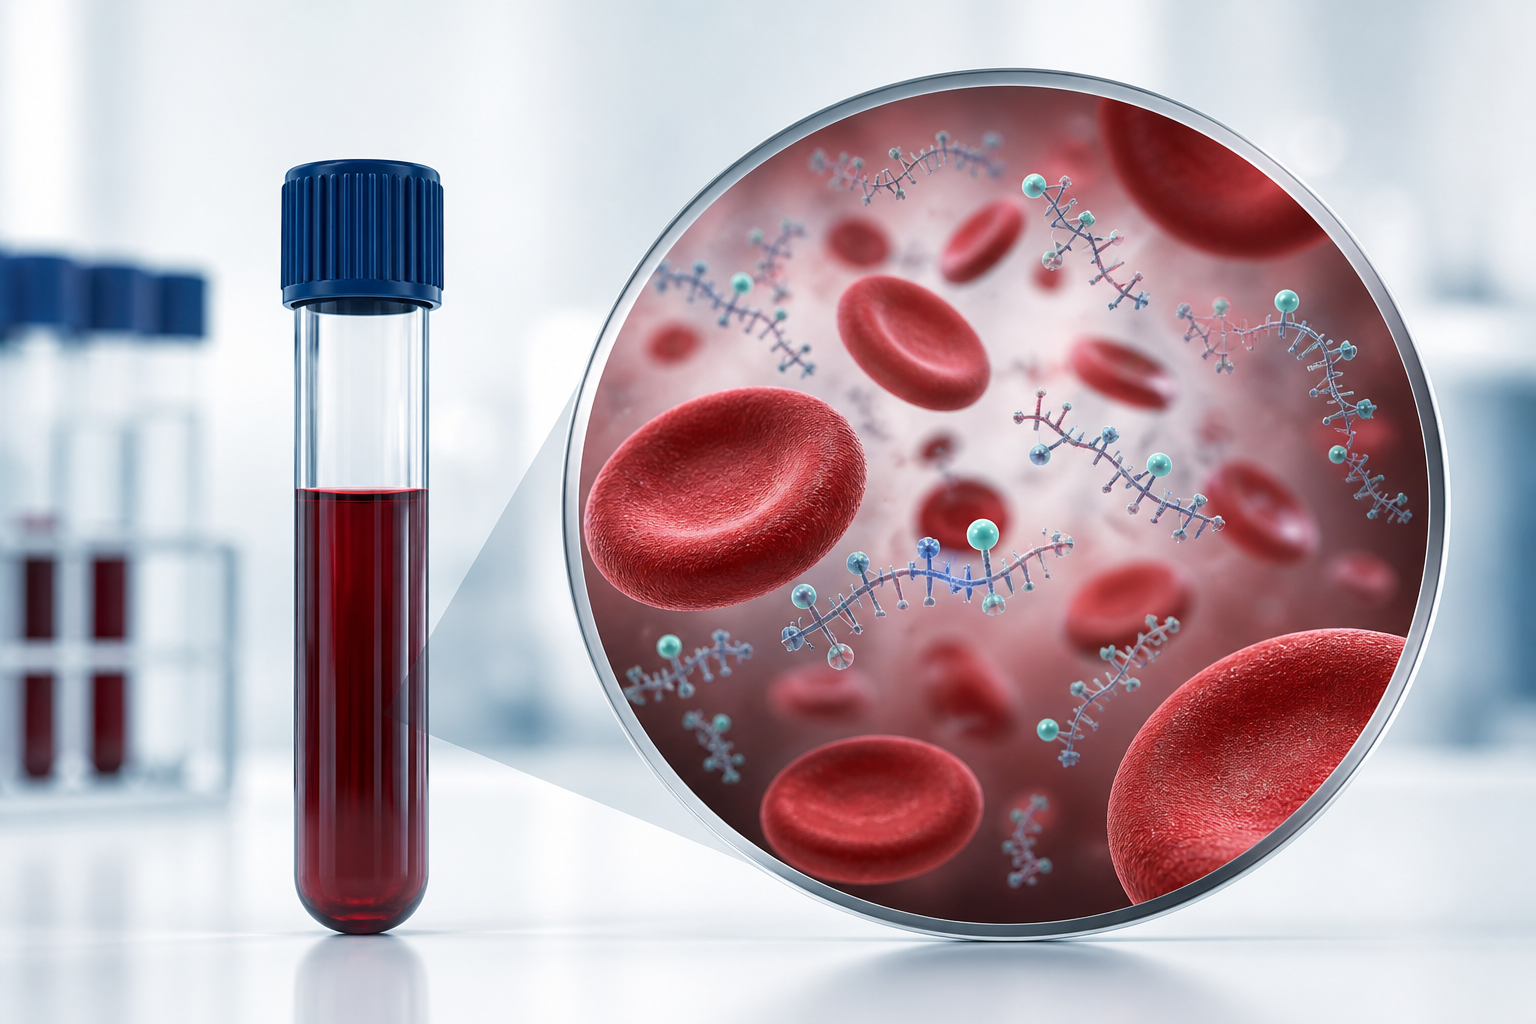
A small human study links frailty with DNA damage and a distinctive blood DNA pattern, but a clinical test remains a distant goal.
Frailty is more than being older. It describes a loss of physiological reserve that can make an infection, a fall or another health challenge harder to recover from. Two people of the same age can differ considerably in that reserve, which is one reason researchers want biological measures that distinguish frailty from healthier aging.
A new paper in Cell Death & Disease explores whether damaged cellular DNA and DNA fragments circulating in blood could provide part of that picture. The investigators found several differences between frail participants and comparison groups, including a striking difference in chemical markings on circulating DNA.
Evidence level: Early Research. This is exploratory human observational research combined with laboratory experiments on donated cells. It does not establish a diagnostic test or a treatment for frailty.
What circulating DNA can reveal
Cell-free DNA consists of fragments outside intact cells, including fragments released as cells die or turn over. Some circulate in the liquid component of blood. Researchers are interested in both how much is present and what its characteristics suggest about the tissues from which it originated.
One characteristic is DNA methylation: chemical marks attached to DNA that help regulate its use and vary between cell types and biological states. Studying these marks can offer clues about tissue activity. A change in methylation is not, by itself, proof that aging has accelerated or that a person will become ill.
Two related investigations
The researchers compared skin fibroblasts, connective-tissue cells grown in the laboratory, from 18 frail participants, 18 healthy older participants and 18 younger controls. A separate circulating-DNA analysis involved 22 frail participants, 15 healthy older participants and 24 younger controls. The frail groups were approximately 79 years old on average; the healthy older groups averaged roughly 72 to 74.
In the fibroblasts, the team measured signals associated with DNA damage, including gamma-H2AX and 53BP1. These proteins accumulate or change around damaged DNA, allowing researchers to examine cellular damage responses through microscopy rather than simply count birthdays.
Under baseline conditions, cells from frail participants showed a higher burden of DNA damage-associated signals. But the response after experimentally induced damage using radiation was not significantly different between the frail and healthy older groups overall. The finding therefore should not be simplified into a claim that frailty means cells cannot repair DNA.
A blood signature, with substantial variation
The circulating-DNA results pointed to higher concentrations and greater variability in frail participants, including unusually high values in some people. That spread matters: a difference between groups does not mean every frail participant has a value clearly outside the healthy range.
Levels of TNF-alpha, an inflammatory signaling protein, were also higher in the frail group. TNF-alpha was associated with the study’s frailty score. A useful nuance in the detailed results is that TNF-alpha and cell-free DNA concentrations did not themselves show a significant correlation, despite both being elevated in the frail group. Parallel group differences do not establish a direct molecular chain of cause and effect.
The most detailed methylation analysis was much smaller still. It used five participants per group, selected for higher circulating-DNA levels to provide enough material for analysis. Comparing frail participants with healthy older controls identified 1,470 regions with different methylation, predominantly lower methylation in the frail samples. Those patterns separated the groups in this selected dataset.
Computational tissue-origin analysis also suggested a possible contribution from the small intestine. That is an inference based on molecular patterns, not direct proof that the intestine caused frailty or that a gut-targeted intervention would help.
Why this is not a diagnostic test
The small, selected methylation sample is a major limitation. A pattern that separates five people from five others may not perform similarly in a large, independent clinical population. Selecting samples with higher DNA concentrations also limits how well the findings represent people with lower concentrations.
Age, underlying illness, medications and other differences can influence biological measurements. Although the researchers included an older comparison group, that design does not eliminate every alternative explanation. The study also cannot establish whether the DNA changes preceded frailty, followed it or developed alongside another process.
A useful clinical test would need to demonstrate reproducible performance across laboratories and populations. Researchers would need to establish sensitivity, meaning how reliably it identifies the condition, and specificity, meaning how well it avoids incorrectly classifying people without it. It would also need to add meaningful information beyond existing clinical assessments.
Most importantly, identifying a biological difference is not the same as knowing what to do about it. Lowering circulating DNA or changing its methylation has not been shown here to reduce frailty, restore independence or extend life.
Why it matters
Frailty research needs measures that capture vulnerability rather than age alone. This study connects cellular damage, inflammation and circulating-DNA patterns in a way that provides concrete leads for larger investigations.
Bottom line
Frailty may leave a measurable signature in blood DNA. The evidence is promising as a research direction, but too preliminary to support a diagnostic service, a personal aging score or a new treatment recommendation.
Source: Farina and colleagues, Elevated baseline DNA damage and hypomethylated circulating free DNA distinguish frailty from healthy aging, Cell Death & Disease, September 4, 2026. Reporting includes the article-in-press methods, Table 1 and detailed results. Featured image: original AI-generated conceptual illustration, not a diagnostic readout.